Untitled attachment
https://cdn.mastodon.technology/media_attachments/files/108/237/919/862/365/548/original/ab35287f2655dded.png
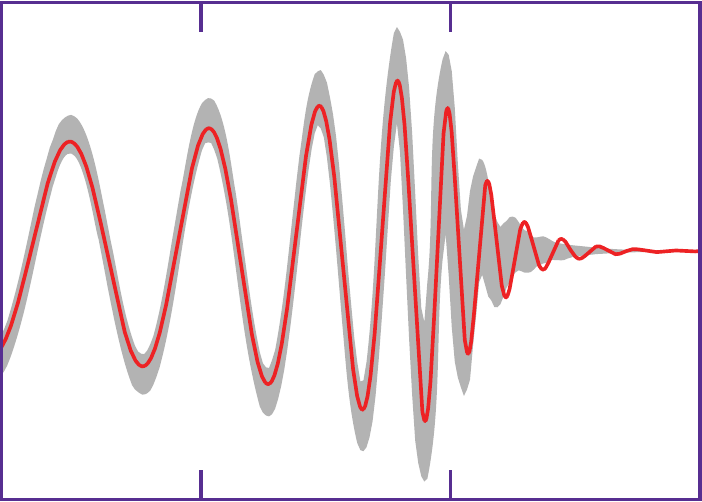
A new version of LabPlot, KDE's data analysis and visualization software, has landed. LabPlot 2.9 comes with color maps and conditional formatting, box plot graphs, support for MATLAB, SAS, Stata and SPSS formats, improved performance, and much, much more:
Chirp! is a social network. It runs on GNU social, version 2.0.1-beta0, available under the GNU Affero General Public License.
![]() All Chirp! content and data are available under the Creative Commons Attribution 3.0 license.
All Chirp! content and data are available under the Creative Commons Attribution 3.0 license.